【Candlestick Charts】FX Beginner Guide: Understanding FX Trends with Candlestick Charts
For beginners in FX investing, choosing the right foreign currency is only part of the journey. In reality, learning how to read FX trend charts is often the first real challenge.
When you open an FX chart and see rows of red and green bars that look like candles, you’re actually viewing one of the most widely used analysis tools in the FX market—candlestick charts.
Candlestick charts not only show whether exchange rates have risen or fallen, but also reflect the balance of buying and selling pressure during a specific period, helping beginners understand the market sentiment behind FX movements.
With the launch of the FX candlestick chart feature in the WeLab Bank App, even users with no trading experience can now observe bullish and bearish candles directly in the app. This makes it easier to gradually learn how to “read” charts and build a solid foundation for technical analysis.
In this article, we’ll explain from the basics:
- What FX candlestick charts are
- The meaning of bullish and bearish candles
- What information a single candlestick shows
- How beginners can use candlestick charts to understand FX trends
What Are FX Candlestick Charts? A Must‑Know for Beginners
FX candlestick charts are one of the most commonly used chart types in the foreign exchange market. Compared to simple line charts, candlestick charts display much more information at a glance, including:
- Whether prices rose or fell during a period
- The size of the price movement
- Whether buyers or sellers were more dominant
💡 For beginners, candlestick charts act like a “market sentiment thermometer”, helping you understand whether buyers or sellers were in control during a specific time.
📌 Because the FX market operates 24 hours a day and experiences frequent price movements, candlestick charts are especially useful for quickly reflecting the tug‑of‑war behind exchange rate changes.
What Do Bullish and Bearish Candles Mean?
The first step to understanding FX candlestick charts is learning how to read it:
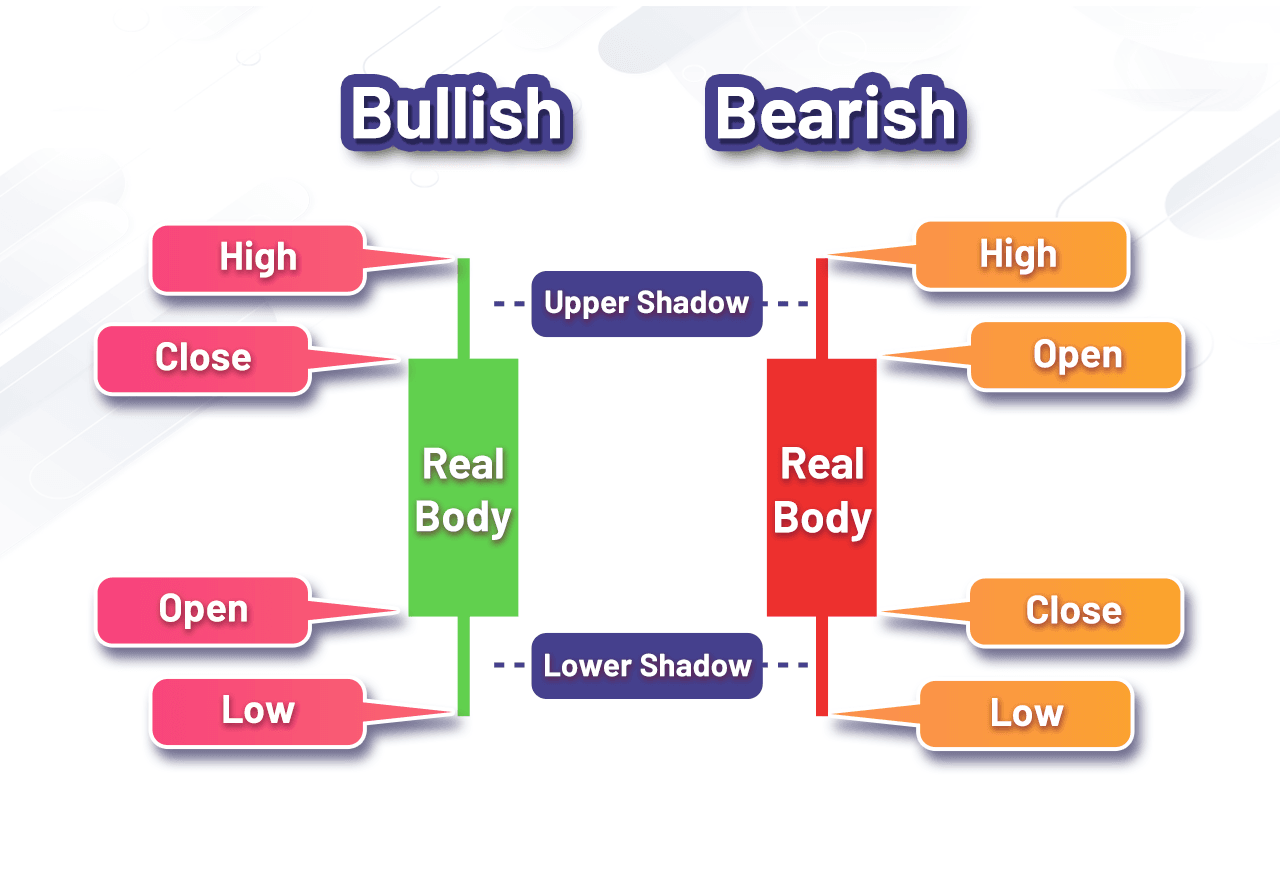
✅ Each candlestick shows four key prices:
- Open Price
- Close Price
- High Price
- Low Price
✅ Bullish Candle (usually green)
- Closing price is higher than the opening price
- Indicates stronger buying pressure
💡 This can be understood as: prices moved upward overall
✅ Bearish Candle (usually red)
- Closing price is lower than the opening price
- Indicates stronger selling pressure
💡 This can be understood as: prices were pushed lower
✅ What do the body and wicks represent?
- Body: the distance between open and close
- Wicks: prices that were tested but not sustained
💡 You can think of wicks as “price tests”—the market attempted to move higher or lower, but was pushed back.
Basic Candlestick Chart Concepts: From Single Candles to Overall Trends
A common beginner mistake is trying to judge the entire FX trend based on a single candlestick. In reality, the true value of candlestick charts lies in how candles appear in sequence.
✅ A simplified way to understand FX trends:
- More consecutive bullish candles → market tends to move upward
- More consecutive bearish candles → market tends to move downward
- Mixed candles with small bodies → market may be ranging or undecided
✅ FX trends are not straight lines
Exchange rates rarely move in one direction continuously. They often include:
- Pullbacks
- Consolidation
- Short‑term counter‑trend moves
💡 Candlestick charts help you observe these rhythm changes.
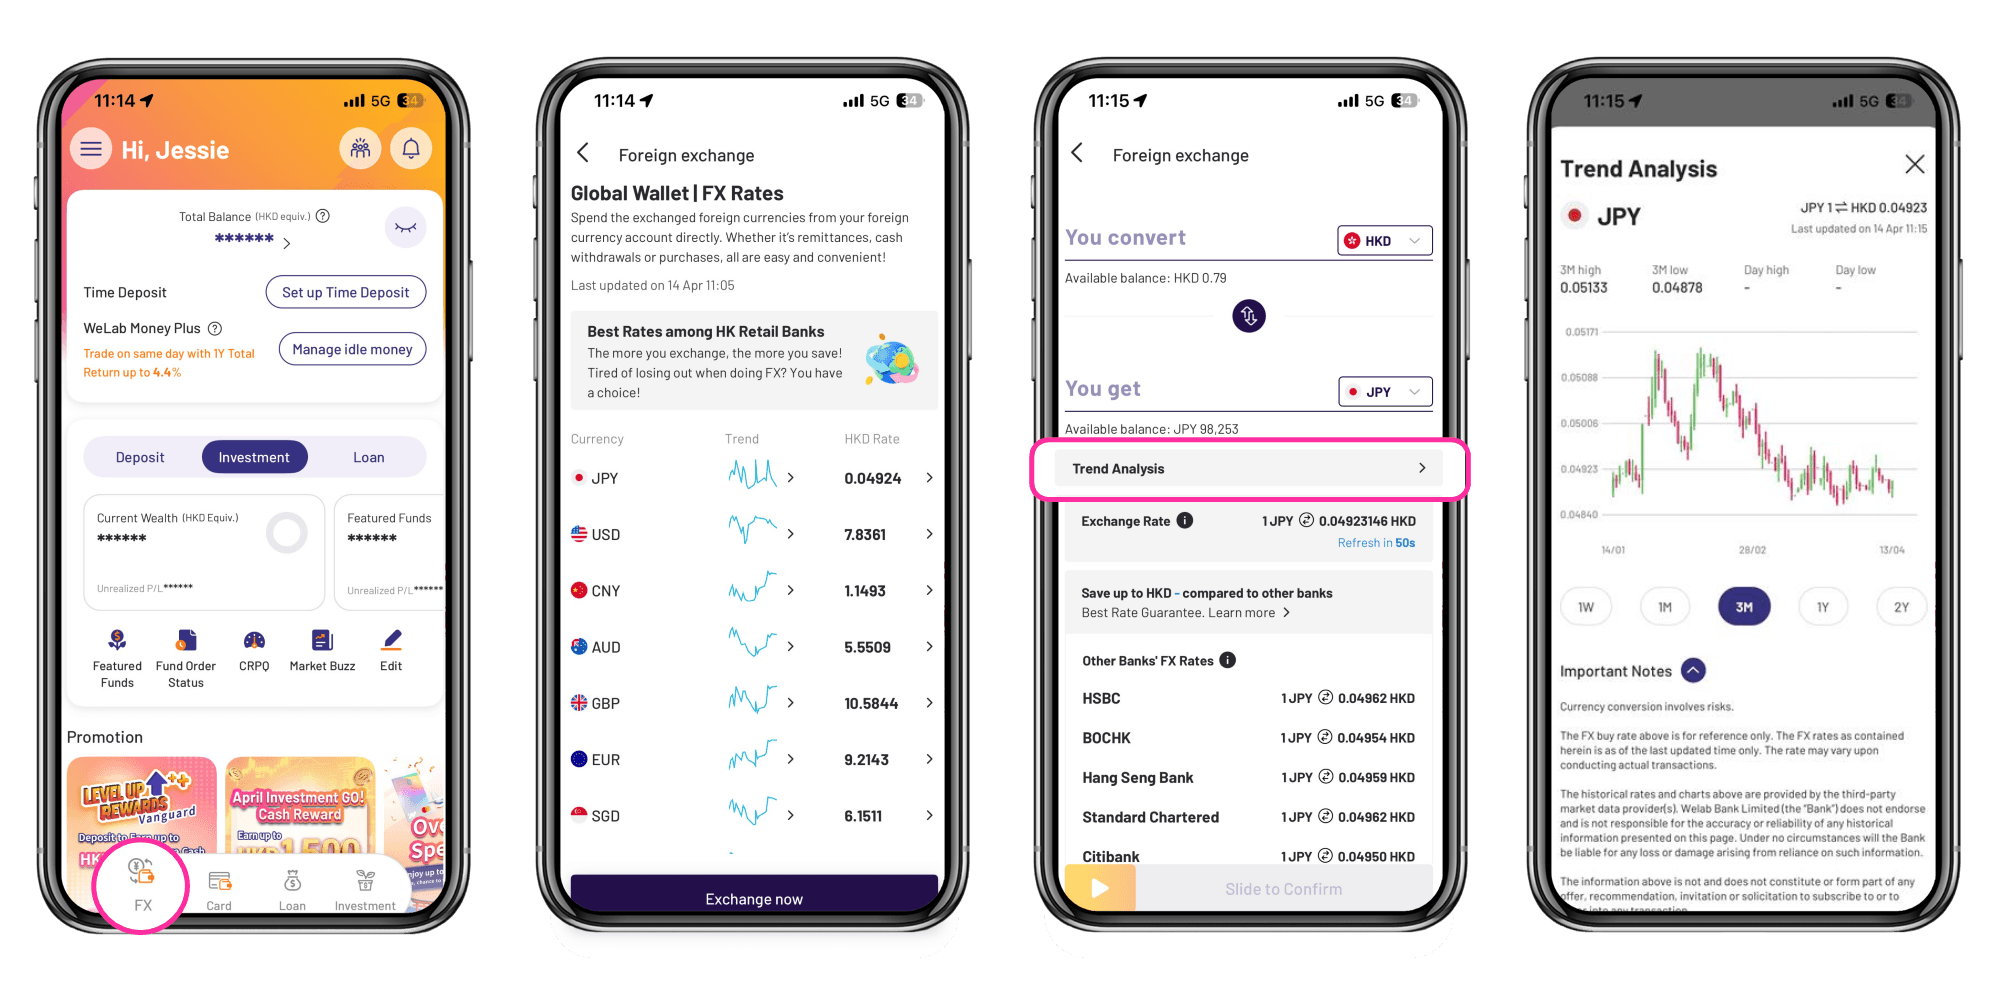
View FX Candlestick Charts in 3 Simple Steps with the WeLab Bank App
For beginners, learning candlestick charts doesn’t require complex professional trading platforms. A clear and easy‑to‑use interface is enough to build basic FX trend awareness.
Step 1: Open the WeLab Bank App and go to “FX”
Step 2: Choose from up to 10 major currencies, including JPY, USD, CNY, AUD, GBP, EUR, SGD, CAD, CHF, and NZD
Step 3: Tap “Trend Analysis” to view FX candlestick charts, at the same time you can switch between timeframes such as 1 week / 1 month / 3 months / 1 year / 2 years
📌 Comparing short‑term and long‑term timeframes helps you understand an important concept “short‑term price movements do not necessarily represent the overall FX trend.”
The screen displays and images on this website are for illustrative purpose only. Please refer to the information displayed in the WeLab Bank App on the transaction day.
Common Beginner Misconceptions About FX Charts
Building the right mindset is just as important as learning the tools.
❌ Misconception 1: A large bullish candle means prices will keep rising
It only shows strong upward movement in the past period, not future certainty.
❌ Misconception 2: Making judgments before a candle closes
The closing price is critical; prices can still reverse before the candle closes.
❌ Misconception 3: Candlesticks can predict the future
Candlestick charts analyze what has already happened, not guaranteed outcomes.
What Should You Learn After Candlestick Charts?
Once you’re comfortable reading FX candlesticks, you can gradually explore:
- Support and resistance levels
- Simple technical indicators (e.g. moving averages)
- Risk management concepts
📢 Understanding FX charts is a step‑by‑step learning process. Candlestick charts are the starting point for building long‑term understanding.
Frequently Asked Questions (FAQ)
Q1: Are FX candlestick charts suitable for complete beginners?
Yes. Candlestick charts are one of the most basic tools in FX technical analysis and are ideal for beginners.
Q2: Do bullish and bearish candles always have to be green and red?
No. Colors vary by platform. What matters is whether the closing price is higher or lower than the opening price.
Q3: Is it enough to rely only on candlestick charts?
Candlesticks provide valuable insights, but they are best used together with other concepts like trends and risk management.
Q4: Are FX candlestick charts different from stock candlestick charts?
The reading method is similar, but FX markets operate 24 hours, so price behavior differs.
Q5: Is learning candlestick charts difficult?
Not at all. Start with the basics and observe real charts regularly—you’ll gradually develop chart‑reading intuition.
By viewing candlestick charts in the WeLab Bank App, you can turn theory into real‑world observation and better understand how FX trends form. 👉 Download the WeLab Bank App now and open an account in as fast as 5 minutes¹ to start building your FX trend knowledge.
Remarks:
(1) Account opening time may vary depending on network conditions, mobile device, and required documents.
Disclaimer: The content, screen displays and images are for information only. Foreign Exchange involves Exchange Rate Risk. The value of foreign currency will be subject to the risk of exchange rate fluctuation. As a result, customer may incur gains or loss of principal in the event that the customer converts Hong Kong Dollar or foreign currency to another currency, and/or in the event that the customer converts a foreign to Hong Kong Dollar. The information above is not and does not constitute or form part of any offer, recommendation, invitation or solicitation to subscribe to or to enter into any transaction.